The return analytics dashboard gives a visual representation of your product return data and displays it in an easy-to-understand form.
Using the return analytics dashboard, you can gain valuable insights into return patterns and customer behavior, helping you make better decisions about pricing, products, the customer experience, and more.
Understanding your returns data and analyzing your store’s performance can help you optimize your returns process to improve profitability and efficiency.
What are Return Analytics?
Return analytics are a way of tracking patterns and trends in your returns data, and identifying opportunities for further improvement.
Your return analytics can help you monitor the operational status of the return system, reduce your return rates, prevent refunds and encourage exchanges/credit, and more.

The data is updated daily, ensuring that you always see the most current insights, with information refreshed up to the previous day. This allows you to track return trends and customer behavior based on the latest available data.
Accessing Your Return Analytics
You can find your return analytics on your ReturnGO dashboard under Analytics > Returns.

All your returns data is displayed in a clear, easy-to-understand way on your ReturnGO return analytics dashboard.
Each tab focuses on a specific aspect of your returns data, and summarizes them over a selected date range, usually with a pie chart and a stacked chart for each type of information.
The charts show the top information, and you can always download a CSV of the full data.
RMA Status
The RMA Status page helps you monitor the performance of your return policies and see how effective your returns process is.
The page includes 3 sections:
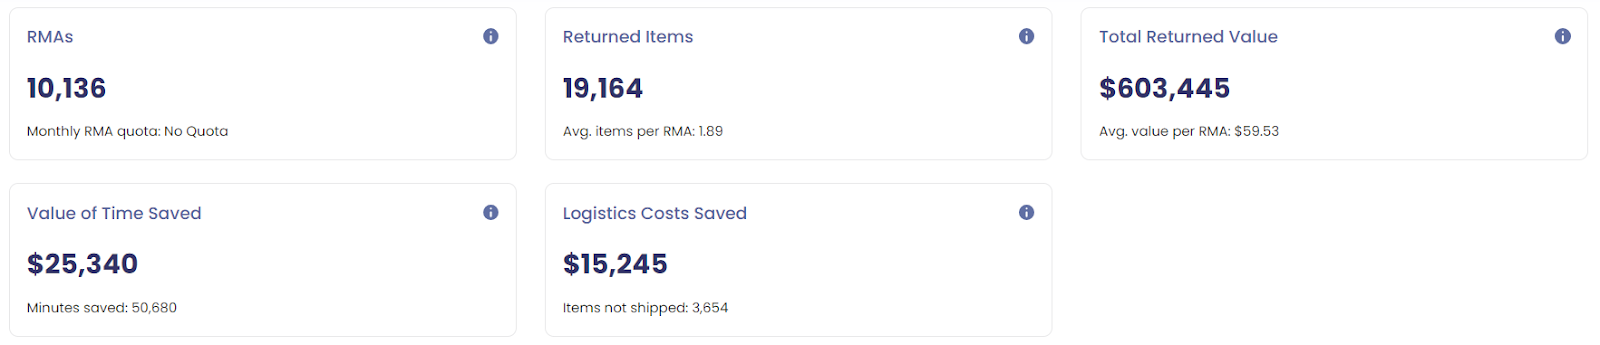
1. Performance overview
See an overview of your RMAs, items, and value.
This helps you analyze how many returns were requested in a certain time frame, identify unusual patterns, see how many items were returned, and how much value was returned.
2. RMAs overview
See a breakdown of the RMA performance, including the number of RMAs and their value over the timeframe.
This enables you to identify key factors and analyze return behavior over time.
Consider, for example, if the number of RMAs is higher than expected - is that a matter of timing or an overall trend?
-png-1.png?width=670&height=384&name=Screenshot%20(65)-png-1.png)
3. Policy performance
See a breakdown of return policies and return methods.
This enables you to track which policies are most used, and identify unusual trends over time.
For example, you can check that the amount of returns paid for by the store vs. returns paid for by the customer matches your expectations.
Another thing you can review is the proportion of RMAs that get handled with automation vs. those that require manual approval, and optimize your process to save time and effort as well as improve the customer experience.

Filter options:
By product - Filter by a specific product or group of products.
By status - Filter by a specific RMA status.
Requested
The requested page enables you to deep dive into the resolutions chosen by customers and the return reasons behind them.
Having a better understanding of what customers want to return and why helps you discover problems with products, sizes, warehouse mistakes, and more.
The top section of the page shows the value of the returns requested by customers, and the distribution over time.
The rest of the page shows the distribution of resolutions, reasons, and products overall, and separately for each return resolution.
-png.png?width=670&height=600&name=Screenshot%20(67)-png.png)
Beyond that, the page is broken down into tabs for each resolution type:
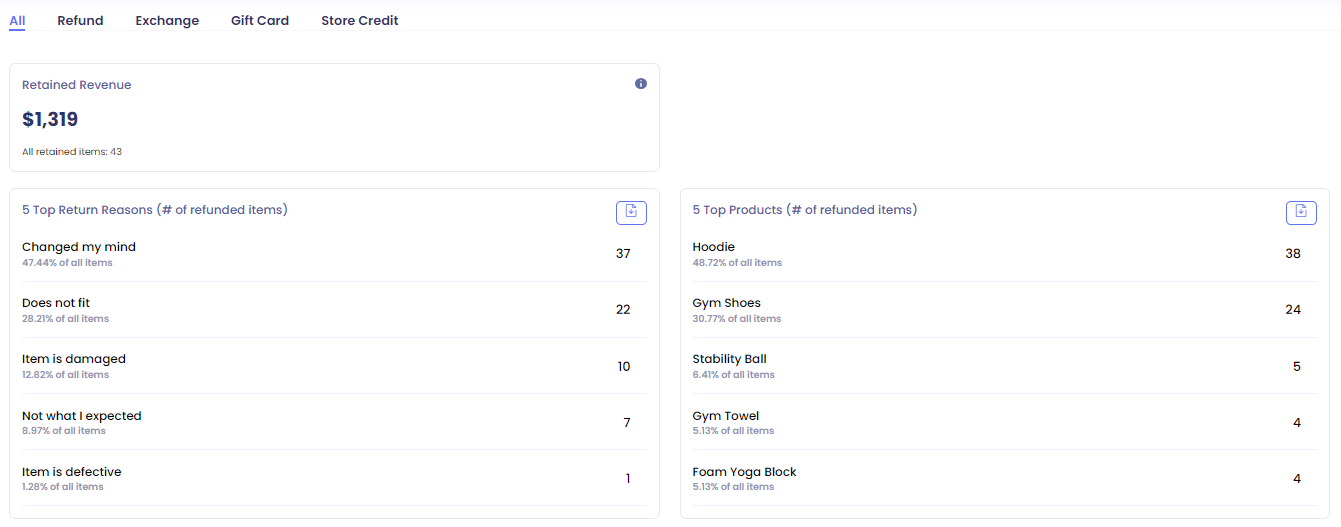
1. All
An overview of all the different resolutions, with a breakdown and a timeline, as well as top return reasons and the most frequently returned products.
Identify what products are returned the most, and the most common reasons for returns.
For example, if you see that “received a wrong item” is one of the top return reasons overall, there may be a problem with the warehouse, resulting in a mix-up of items.
Filter options:
By product - Track the most common resolutions and return reasons for a specific product.
By return reason - Track what resolutions customers choose when marking a specific return reason.
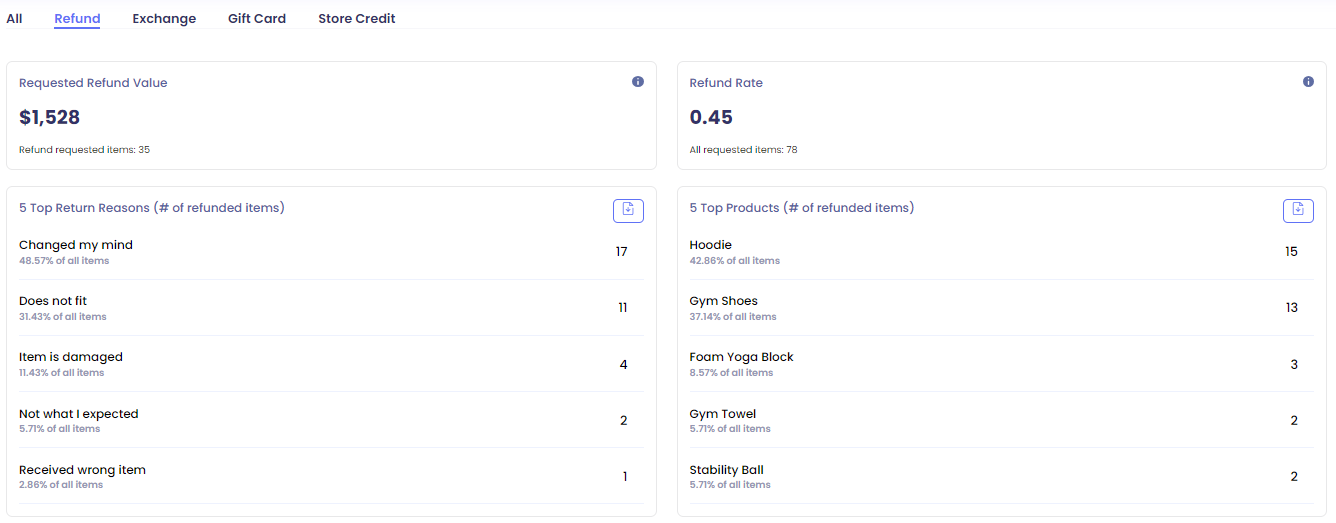
2. Refunds
Provides a deep dive into customers’ requested refunds.
Things to consider:
- Reduce your refund rate by reviewing return reasons and returned products, and take action to try to convert those returns into exchanges.
- Look at which products have the most refunds, to identify issues with a specific product which you can address and reduce your returns.
Filter options:
By product - provides the ability to deep dive into a specific product or group of products.
By return reason - provides the ability to analyze a specific return reason or return reason groups.
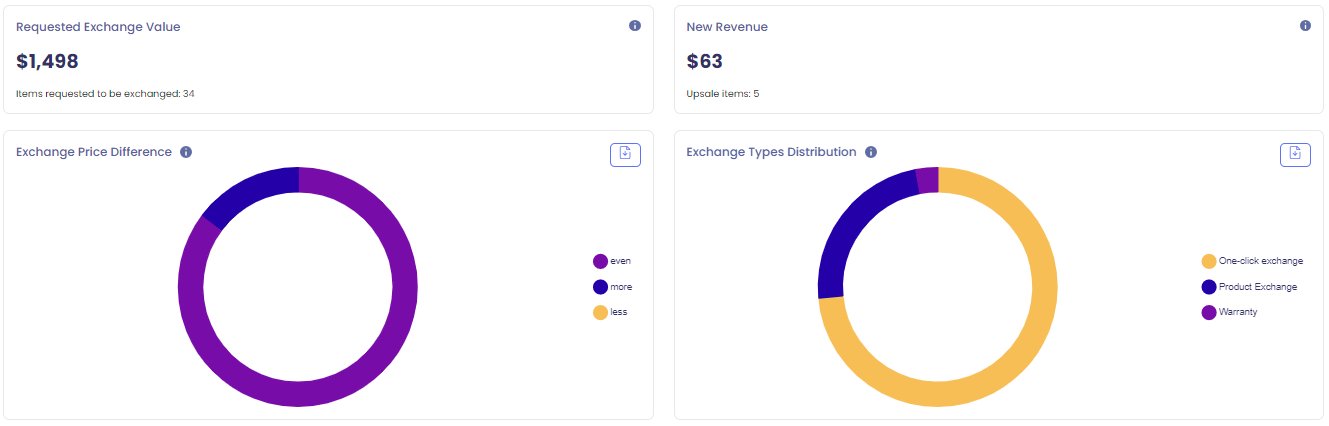
3. Exchanges
Provides a deep dive into customers’ requested exchanges.
Things to consider:
- How often do customers exchange to products of the same price, cheaper, or more expensive?
- Do customer exchange for different variants or different products? When variant exchanges are more common, this may indicate sizing issues, while when product exchanges are more frequent, this could indicate problems with coloring or product quality.
- What products are most exchanged? This may indicate sizing issues that can be fixed and reduce the amount of returns.
- What are the top return reasons? This provides an indication of why customers are exchanging products, which provides additional data that can be used to optimize products and variants.
Filter options:
By product - provides the ability to deep dive into a specific product or group of products.
By return reason - provides the ability to analyze a specific return reason or return reason groups.
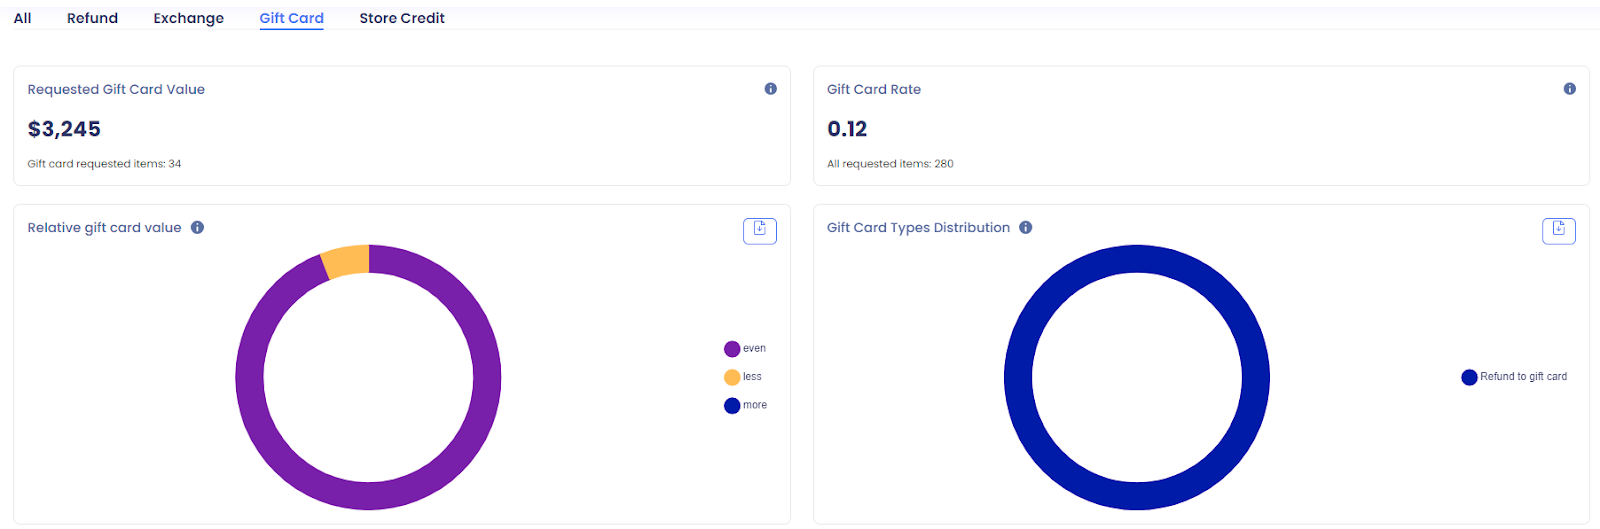
4. Gift Cards
Provides a deep dive into customers’ requests for gift cards.
Things to consider:
- How many gift cards were issued, and how many were redeemed? This lets you see if customers use the gift cards they receive.
- Do customers add more cash when buying with gift cards? This can indicate if giving a gift card can be a potential upsell or new revenue stream.
- What are the top reasons customers give for gift card requests and do you expect those reasons?
- What are the top returned products for gift cards?
Filter options:
By product - provides the ability to deep dive into a specific product or group of products.
By return reason - provides the ability to analyze a specific return reason or return reason groups.
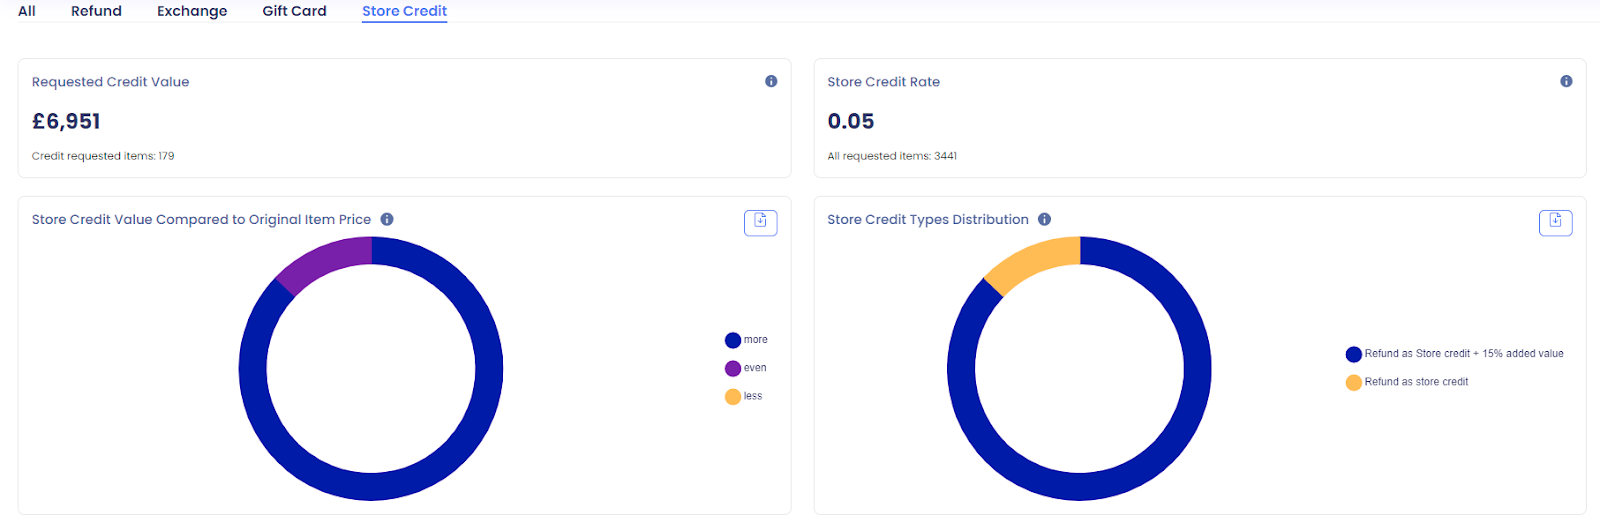
5. Store Credit
Provides a deep dive into customers’ requests for store credit.
Things to consider:
- How much store credit was issued, and how much was redeemed? This shows you if customers use the store credit they receive.
- Do customers add more cash when buying with store credit? This shows if giving store credit is a potential upsell or new revenue stream.
- What are the top return reasons customers ask for store credit, and do you expect those reasons?
- What are the top returned products for store credit?
Filter options:
By product - provides the ability to deep dive into a specific product or group of products.
By return reason - provides the ability to analyze a specific return reason or return reason groups.
6. Return Reason & Answers by Product
Provides a detailed breakdown of why customers are returning specific products, including the return reason and the answer selected, helping you identify product-level issues.
Tip: To see the product SKU, you need to select a specific product.
The Return Reason & Answers by Product table includes the following columns:
- Product ID: The unique identifier of the product. Clicking the Product ID redirects you to the product page in your eCommerce platform.
- Product Name: The name of the product as listed in your store.
- SKU: The product's stock keeping unit.
- Return Reason: The reason selected by the customer for returning the item.
- Return Reason Answer: The answer to the follow-up question.
- Product Returns Count: The total number of returned items for the product overall. This value is repeated for each reason-answer combination.
- Returned Items: The number of returned items associated with the specific reason and answer.
- Return Rate: The percentage of returned items relative to the number of items sold.

Note: You can click the download icon to export the data into a CSV file.
Processed
The processed page enables you to monitor and review the transactions issued to customers. The system displays the amount of money given as refunds, store credit, gift cards, and the value of exchanged products.
The page includes 2 parts:
1. Performance
See an overview of processed transactions. This enables you to track how many transactions were issued in the timeframe via ReturnGO and via the store platform (i.e Shopify) and determine whether the number is in line with your expectations.
Things to consider:
- How much value did you give in each resolution?
- Store credit, gift card, and exchange transactions can be an additional revenue stream and provide new revenue by customers adding extra money while redeeming credits or product upsells in exchanges.
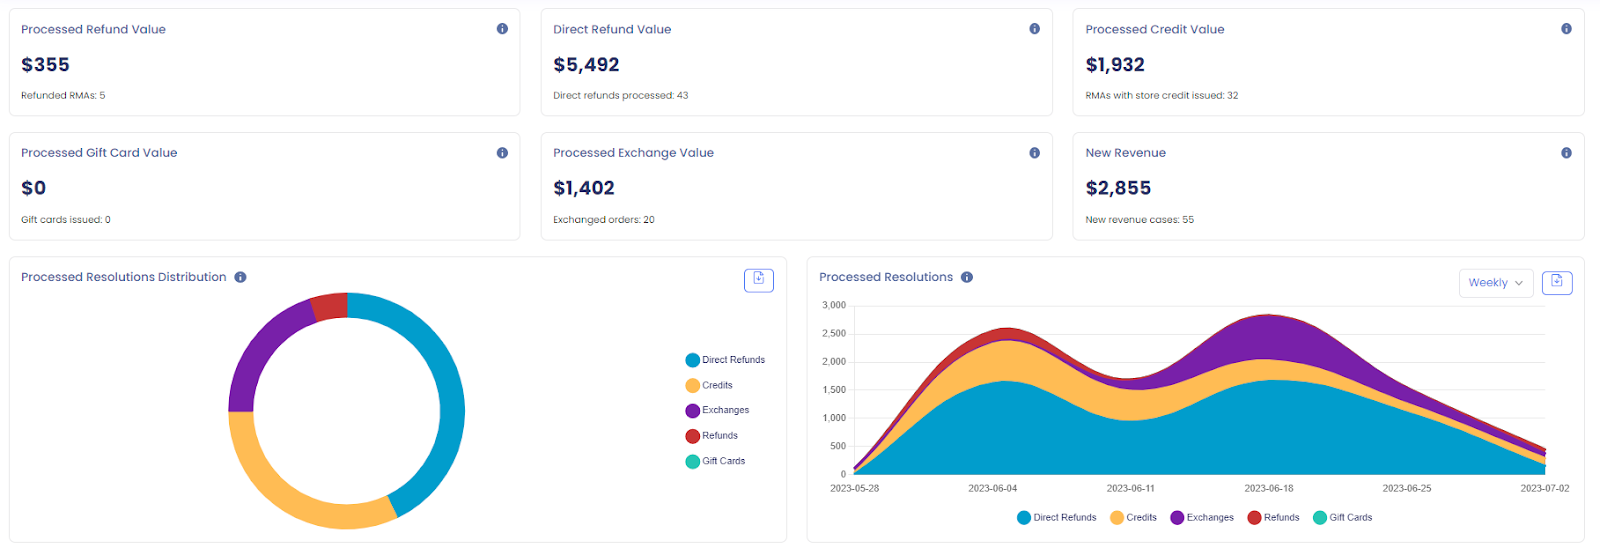
2. Timeline and processed resolution breakdown
Compare the processed resolution value and monitor the transactions over time.
Track how many transactions were issued, see if the financial loss associated with refunds is in line with expectations, and identify any unusual patterns.
At the top of the page, you can see the actual processed value.

Then you can track the breakdown of the resolutions that were issued and their distribution over time.

You can also see how much store credit and gift card value was issued, and how much was redeemed and added to, as well as their distribution over time.

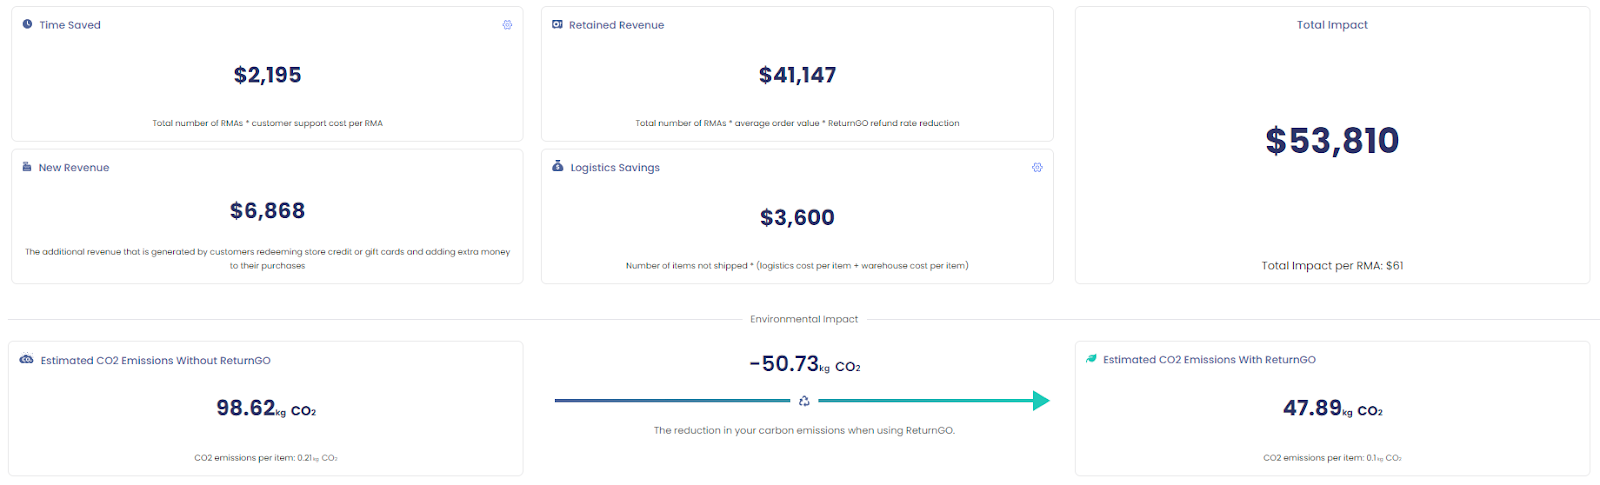
ReturnGO Impact
The impact page shows how much your store has saved in terms of revenue, time, and environmental impact by using ReturnGO.
Information you can see about the impact of ReturnGO on your store includes:
- Retained revenue
- Paid amount of items that were returned but not refunded and instead resolved via store credit, gift card, or exchange.
- Time saved
- Logistics costs saved
- New revenue generated
- Reduction in CO2 emissions
By tracking the impact on your store, you can identify key points where you save time and money by using ReturnGO to streamline your returns management.